PrERT-CNM-v4
Phase 3 Visual Dashboard
Snapshot date: 2026-04-07
Purpose
Provide a visual and tabular status view of dataset shape, held-out classifier quality, and Bayesian posterior behavior across four Phase 3 variants:
- Baseline model:
multinomial_naive_bayes(phase-3-nb) - Upgraded model:
logreg_tfidf(phase-3-logreg) - Ablation model:
logreg_tfidfwith Bayesian scoring disabled (phase-3-no-bayes) - Transformer model:
privacybert(phase-3-privacybert)
Classifier metrics remain the baseline quality surface. Bayesian posterior outputs are included as a decision surface where available; no-bayes runs are marked as N/A by design.
Data Sources
artifacts/phase-3-nb/dataset_manifest.jsonartifacts/phase-3-nb/classifier_metrics.jsonartifacts/phase-3-nb/bayesian_risk_test.jsonartifacts/phase-3-logreg/dataset_manifest.jsonartifacts/phase-3-logreg/classifier_metrics.jsonartifacts/phase-3-logreg/bayesian_risk_test.jsonartifacts/phase-3-no-bayes/dataset_manifest.jsonartifacts/phase-3-no-bayes/classifier_metrics.jsonartifacts/phase-3-privacybert/dataset_manifest.jsonartifacts/phase-3-privacybert/classifier_metrics.jsonartifacts/phase-3-privacybert/bayesian_risk_test.jsonartifacts/phase-3-nb/calibration_test.jsonartifacts/phase-3-logreg/calibration_test.jsonartifacts/phase-3-no-bayes/calibration_test.jsonartifacts/phase-3-privacybert/calibration_test.jsonartifacts/phase-3-nb/threshold_sweep_test.jsonartifacts/phase-3-logreg/threshold_sweep_test.jsonartifacts/phase-3-no-bayes/threshold_sweep_test.jsonartifacts/phase-3-privacybert/threshold_sweep_test.jsonartifacts/phase-3-nb/bootstrap_ci_test.jsonartifacts/phase-3-logreg/bootstrap_ci_test.jsonartifacts/phase-3-no-bayes/bootstrap_ci_test.jsonartifacts/phase-3-privacybert/bootstrap_ci_test.jsonartifacts/phase3_run_history.jsonl
Executive Summary
| Area | Metric | Current Value |
|---|---|---|
| Dataset | Total rows | 19720 |
| Dataset | Class mix (org/system/user) | 84.18% / 3.81% / 12.00% (0.841836 / 0.038134 / 0.120030) |
| Split | Train / Validation / Test | 79.34% / 9.14% / 11.52% (0.793357 / 0.091430 / 0.115213) |
| Model | NB test accuracy / macro F1 | 81.47% / 64.01% (0.814701 / 0.640117) |
| Model | LogReg test accuracy / macro F1 | 89.26% / 77.90% (0.892606 / 0.779024) |
| Model | No-Bayes test accuracy / macro F1 | 89.26% / 77.90% (0.892606 / 0.779024) |
| Model | PrivacyBERT test accuracy / macro F1 | 95.60% / 89.20% (0.955986 / 0.891999) |
| Delta | LogReg vs NB (test accuracy / macro F1) | +7.79% / +13.89% (+0.077905 / +0.138907) |
| Delta | No-Bayes vs NB (test accuracy / macro F1) | +7.79% / +13.89% (+0.077905 / +0.138907) |
| Delta | PrivacyBERT vs NB (accuracy / macro F1) | +14.13% / +25.19% (+0.141285 / +0.251882) |
| Bayesian | Test posterior overall (NB/LogReg/NoB/PB) | 0.952613 / 0.809707 / N/A / 0.987510 |
| Leakage | Policy overlap (all split pairs) | 0 |
Figure Table
| Figure ID | Figure Preview | Key Takeaway |
|---|---|---|
| Fig 5 | 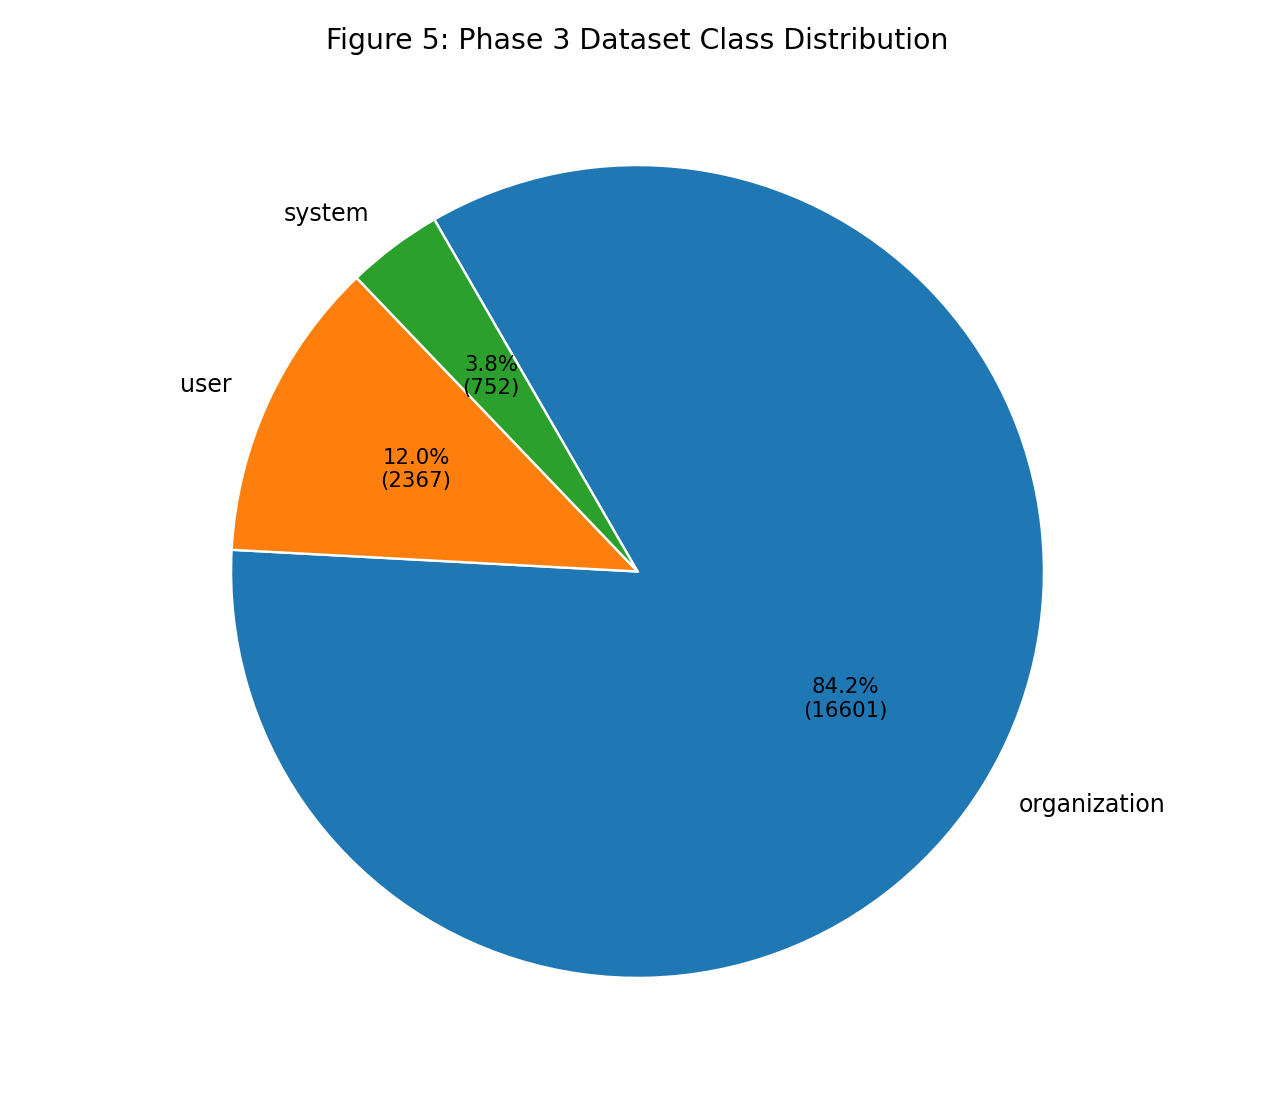 |
Corpus remains organization-heavy, so macro and per-class metrics are still required for fair model comparison. |
| Fig 6 | 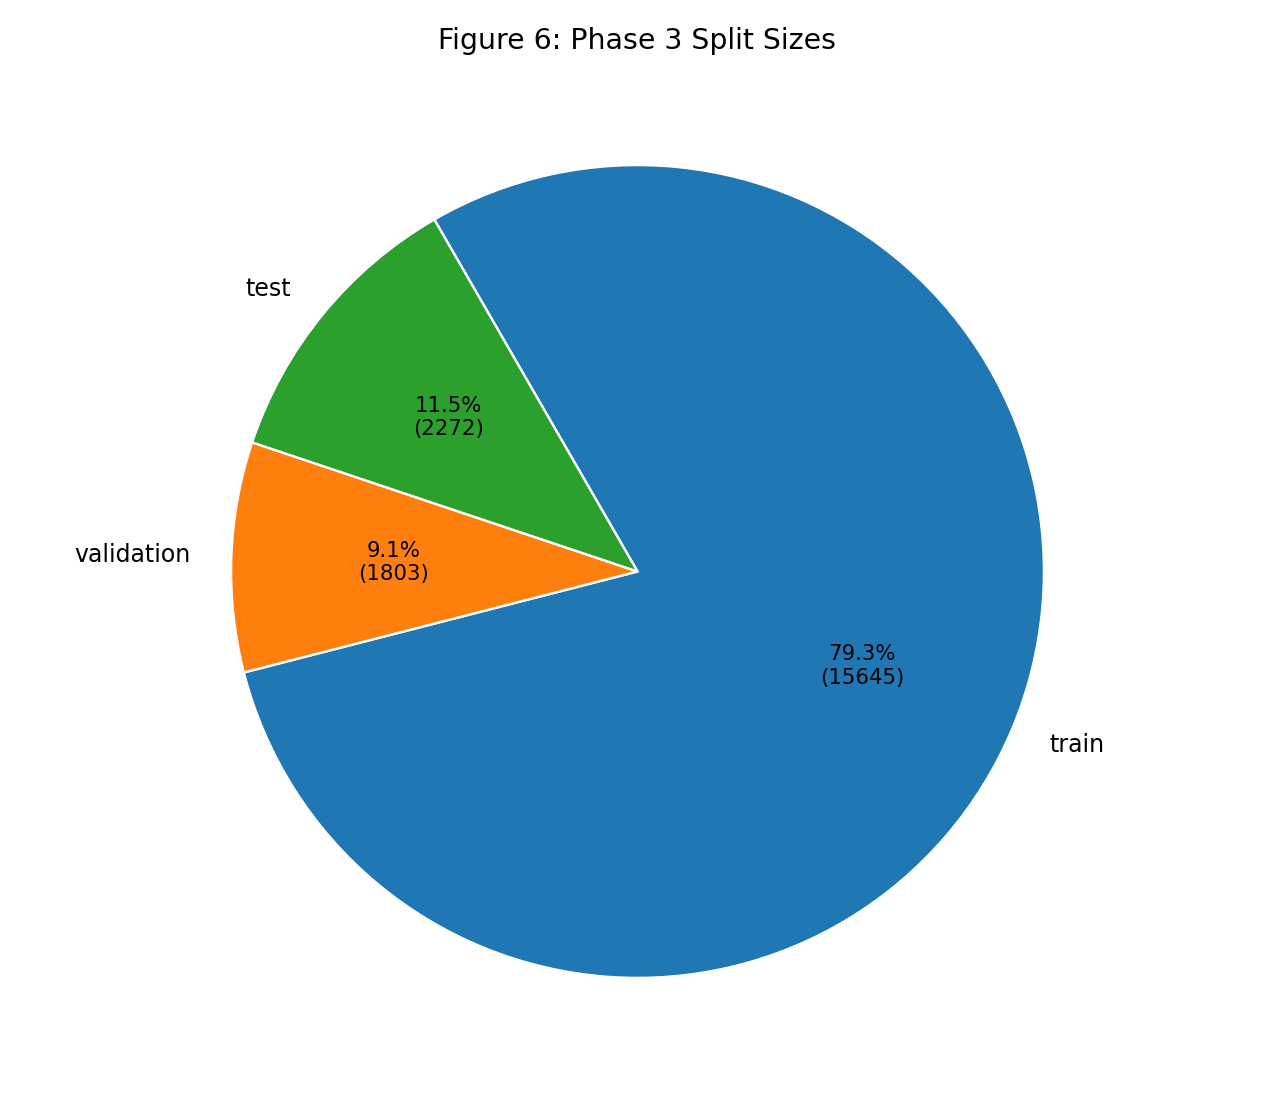 |
Train-heavy split is stable for learning while preserving validation/test hold-outs with zero policy overlap. |
| Fig 7 | 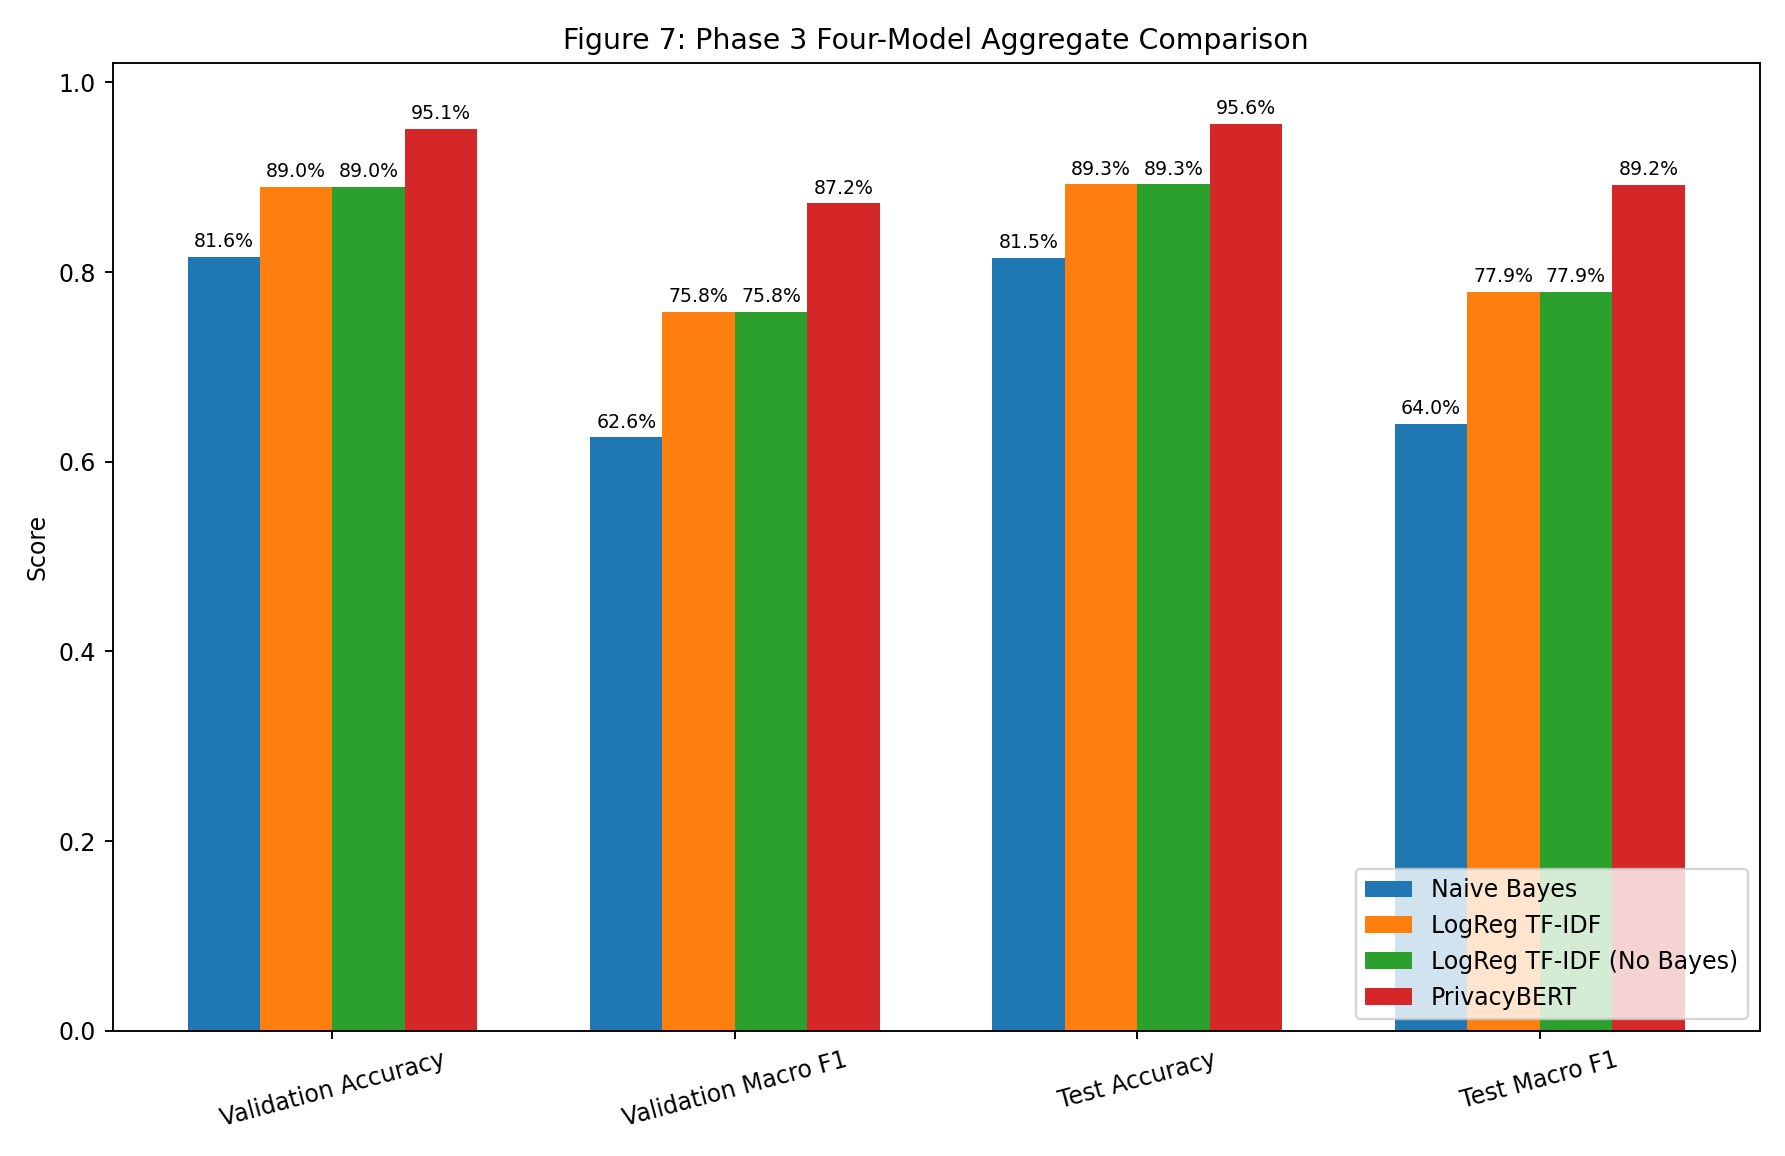 |
PrivacyBERT leads aggregate quality; LogReg and No-Bayes are classifier-identical and both improve over NB. |
| Fig 8 | 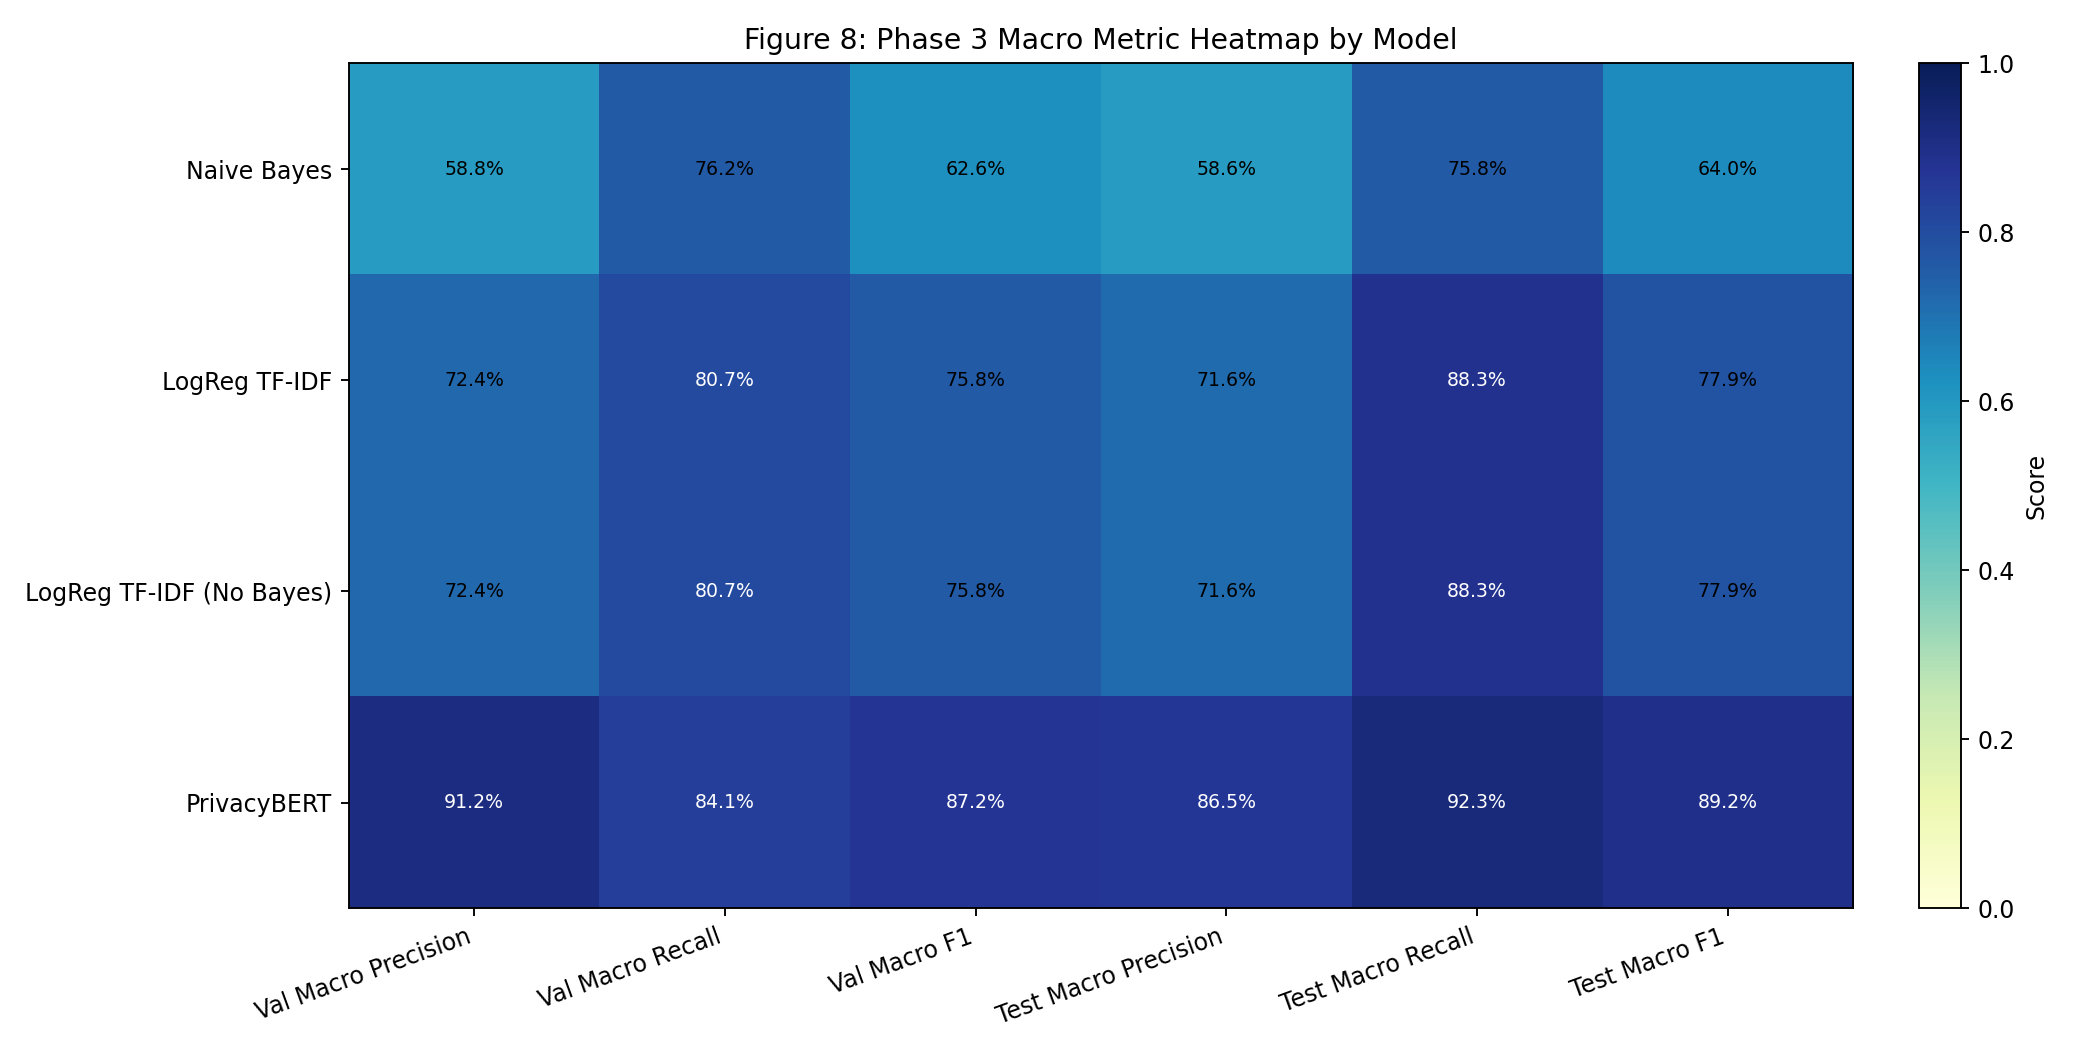 |
Heatmap highlights strongest macro precision/recall/F1 concentration in PrivacyBERT and mid-tier gains from LogReg. |
| Fig 9 | 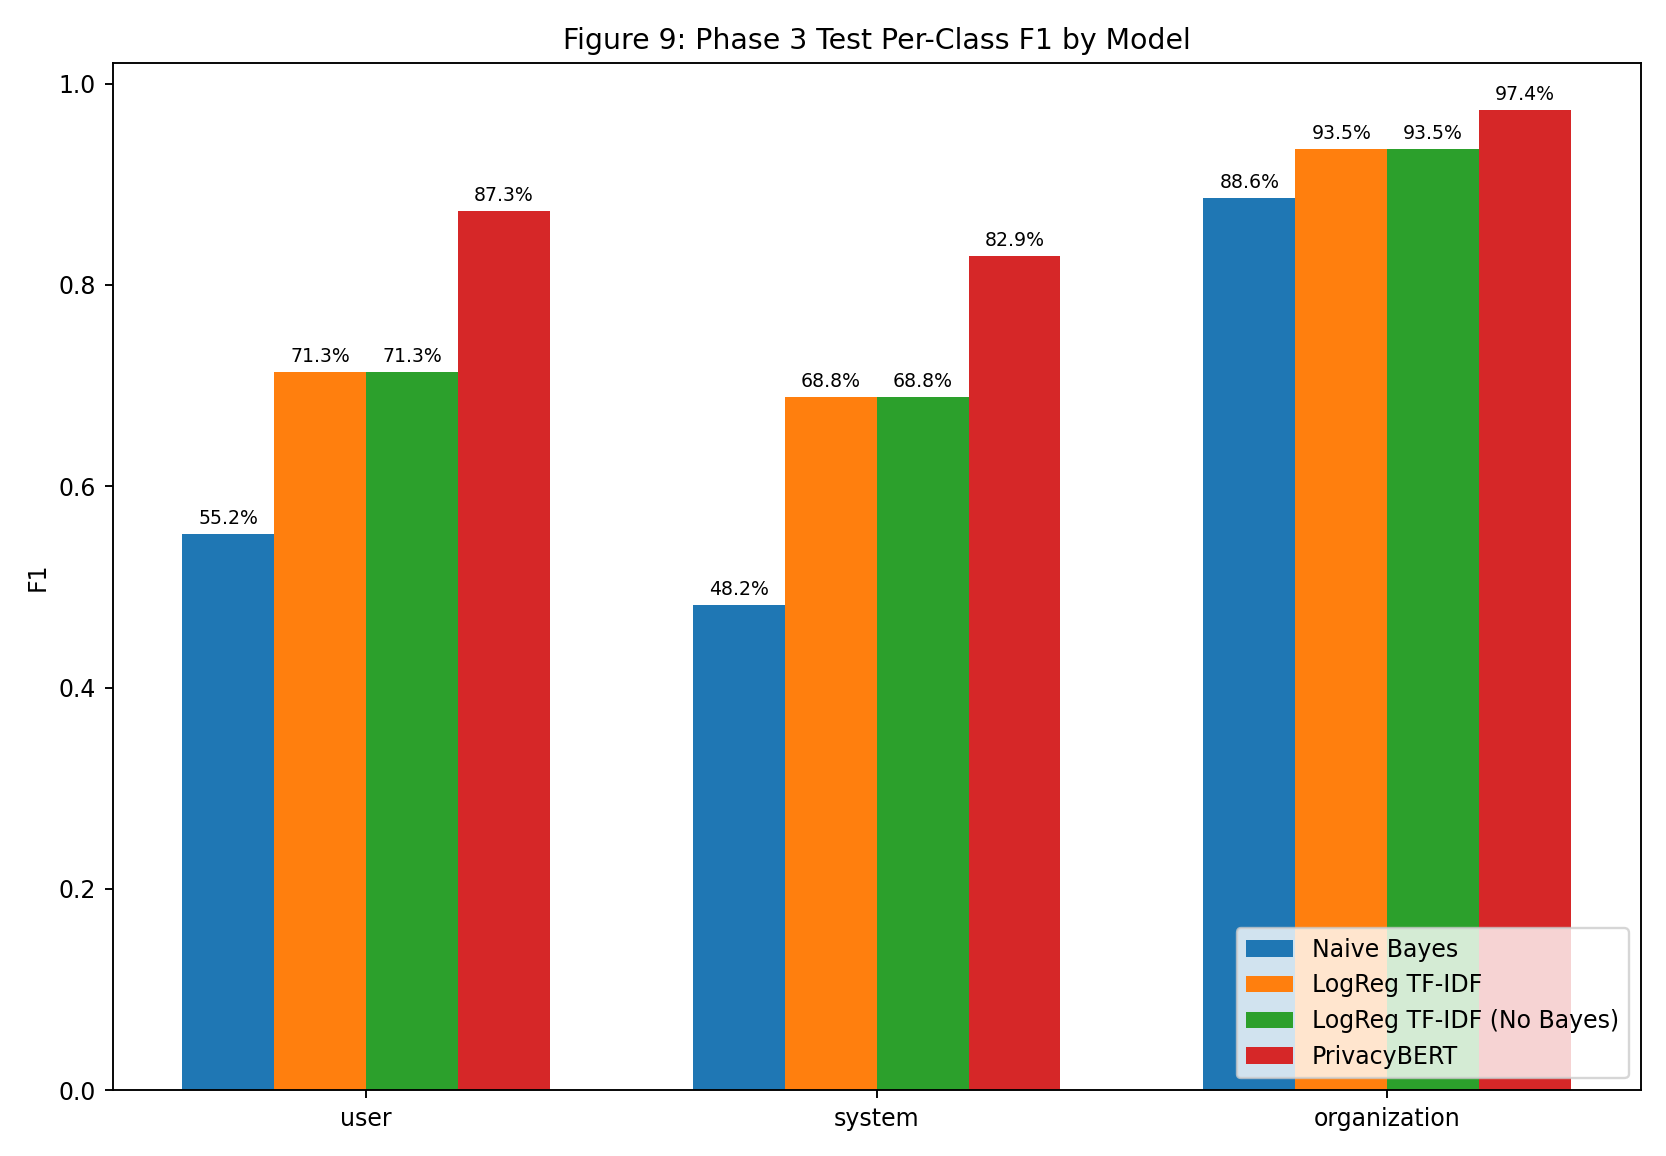 |
Minority-class F1 gains are largest when moving from NB to LogReg/PrivacyBERT, especially on system. |
| Fig 10 | 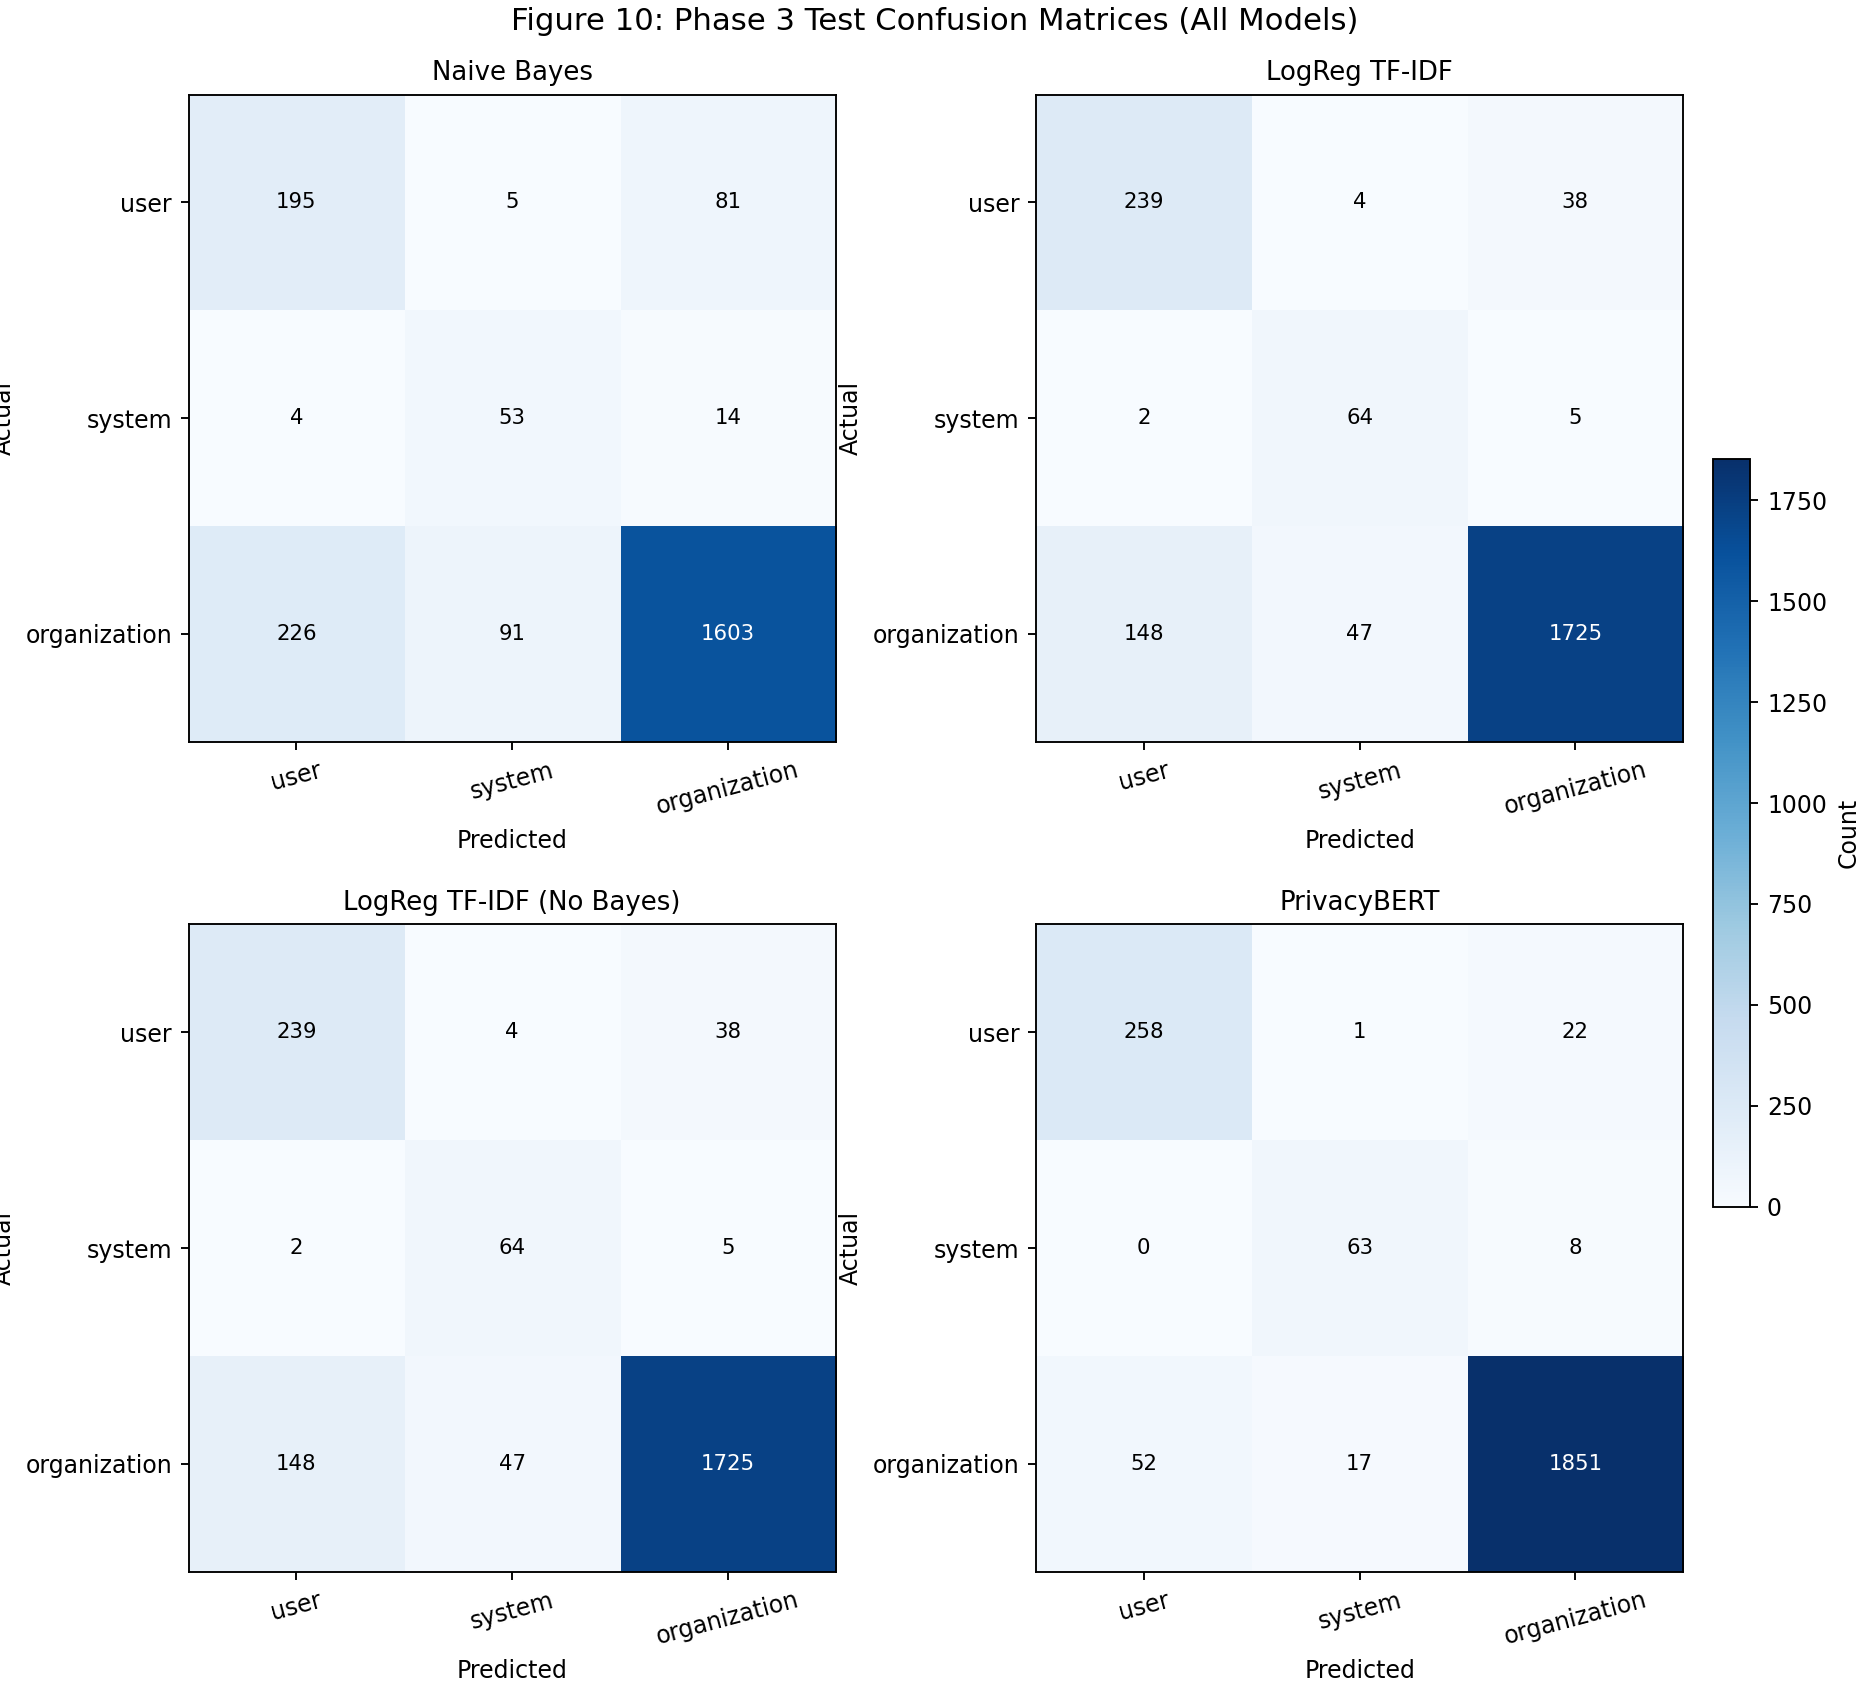 |
Confusion small multiples show spillover reduction from NB to LogReg and strongest diagonal concentration in PrivacyBERT. |
| Fig 11 | 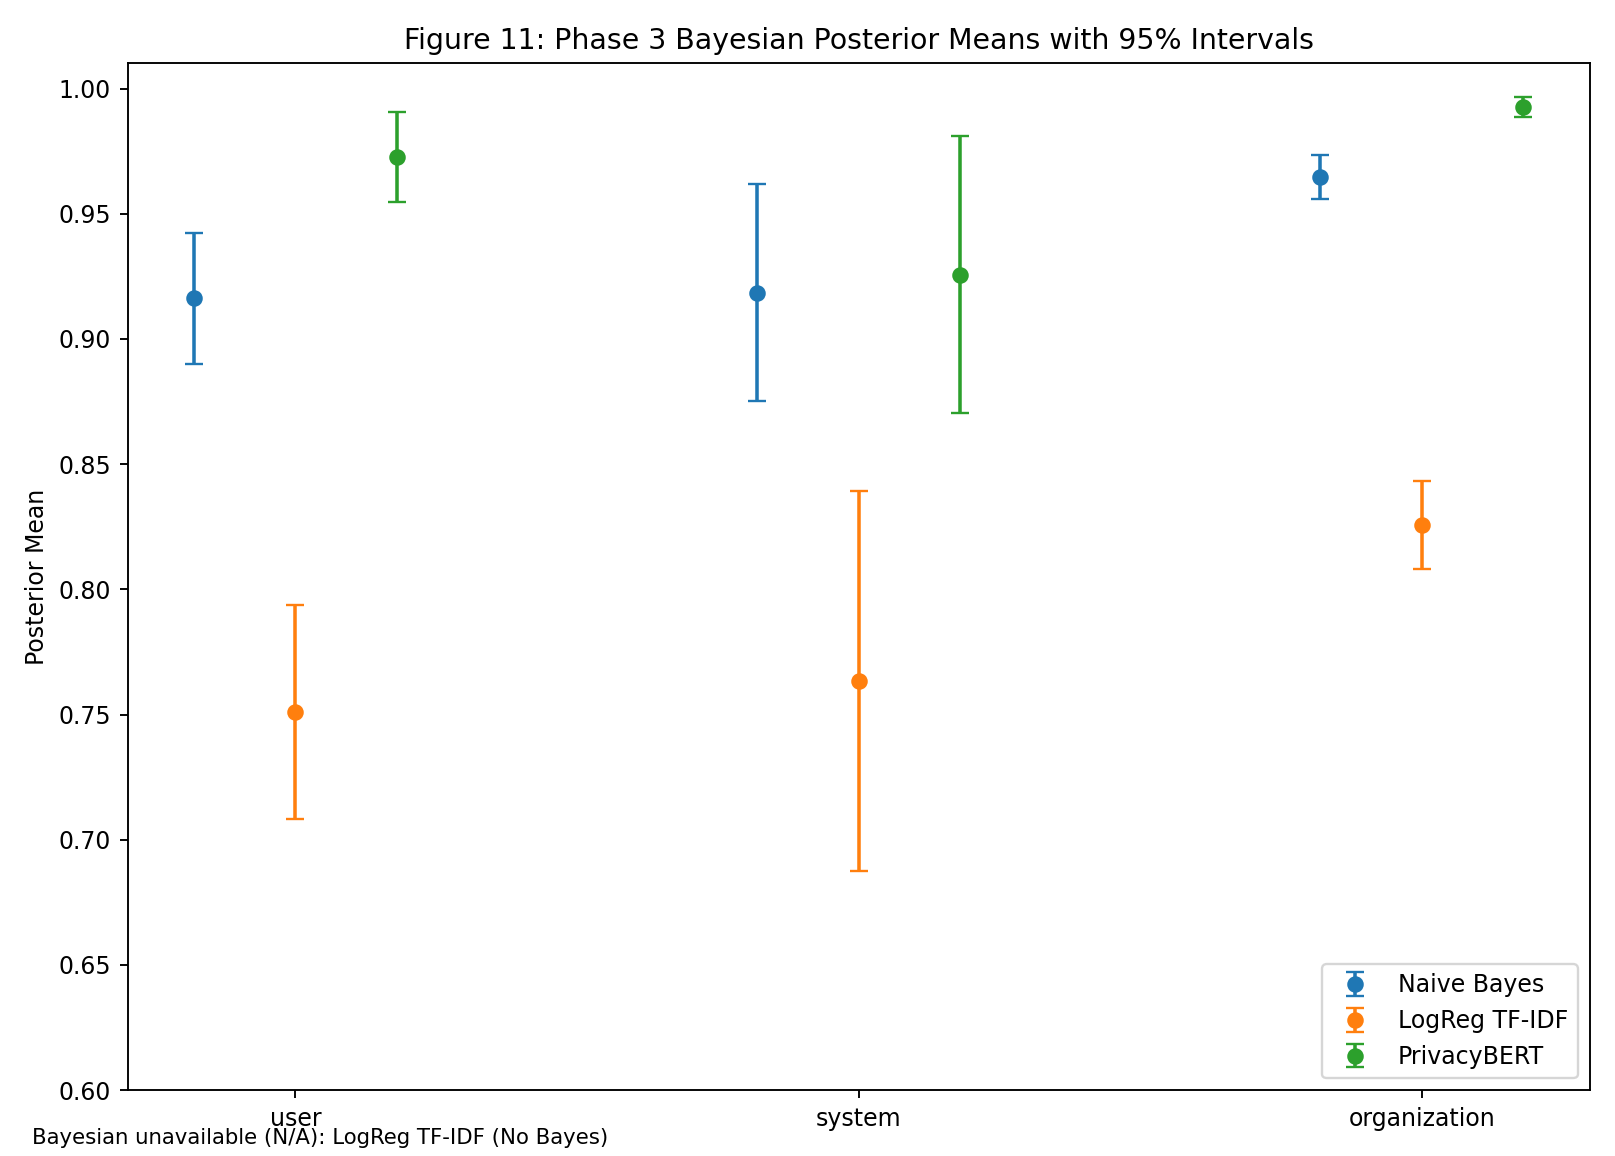 |
Bayesian posterior means/intervals separate model uncertainty profiles; No-Bayes is intentionally excluded as N/A. |
| Fig 12 | 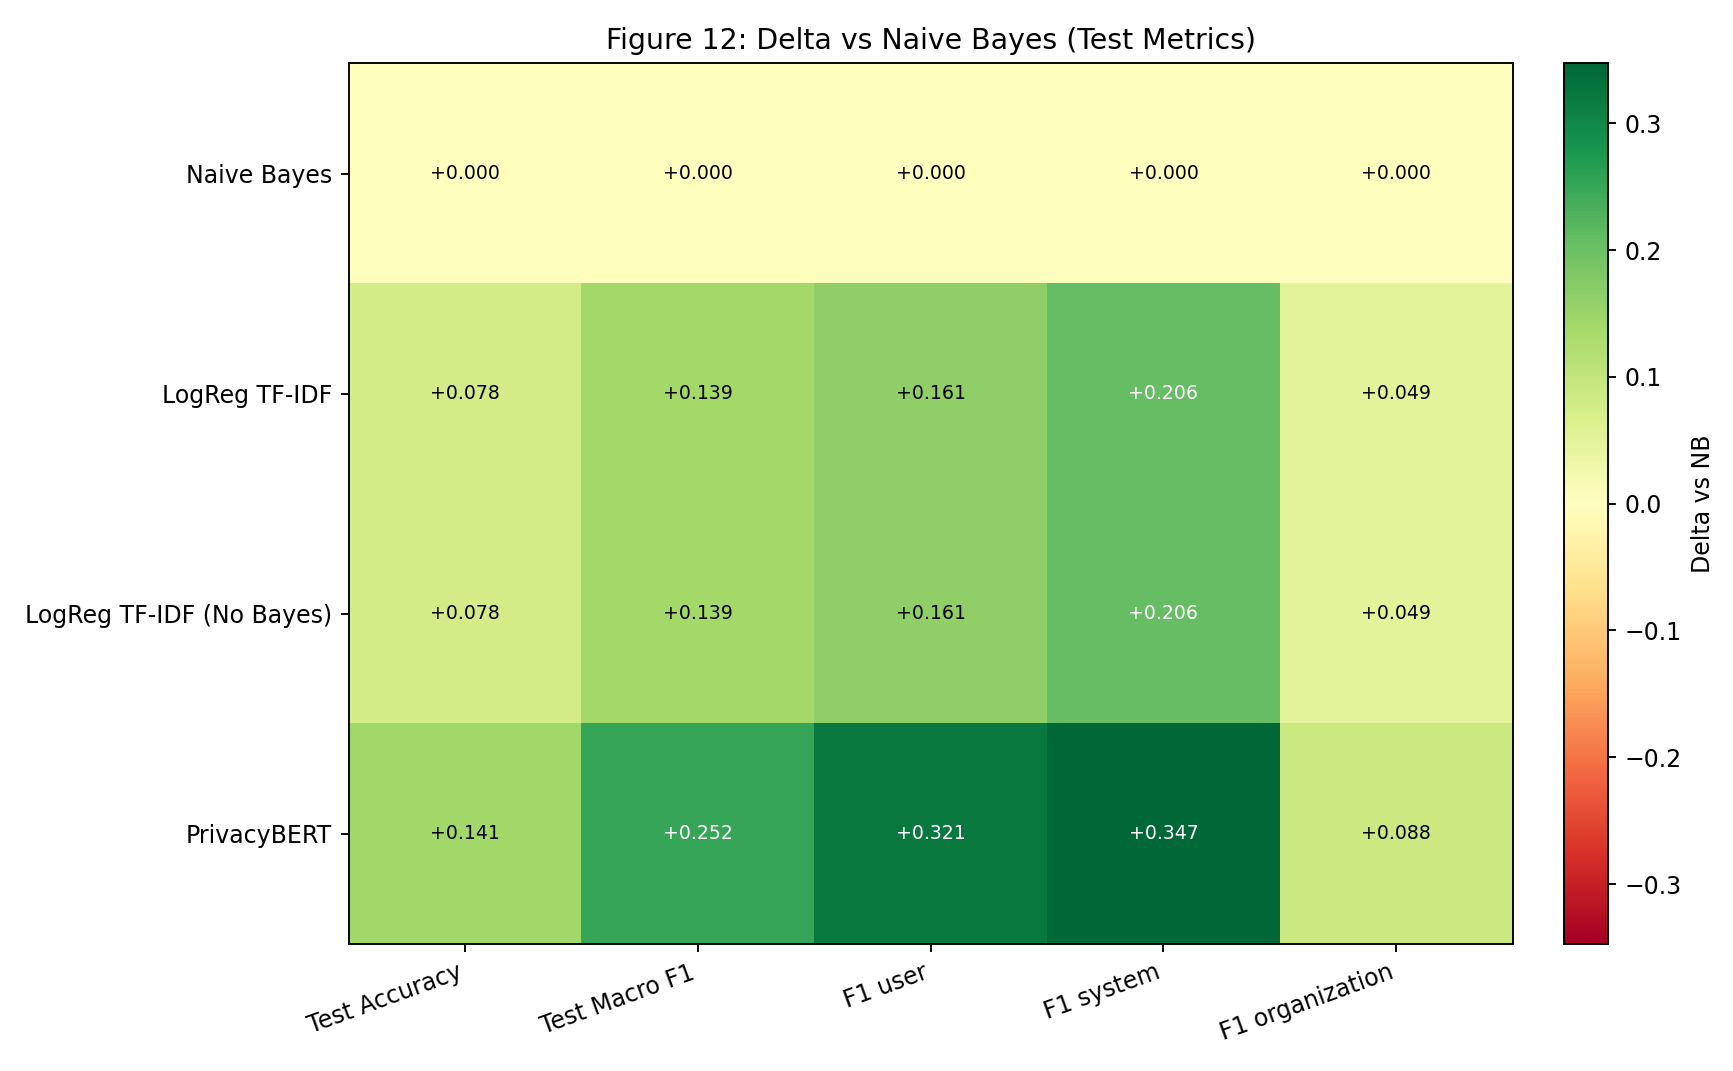 |
Delta map makes improvement vs NB explicit and shows that classifier gains for LogReg and No-Bayes are identical. |
| Fig 13 | 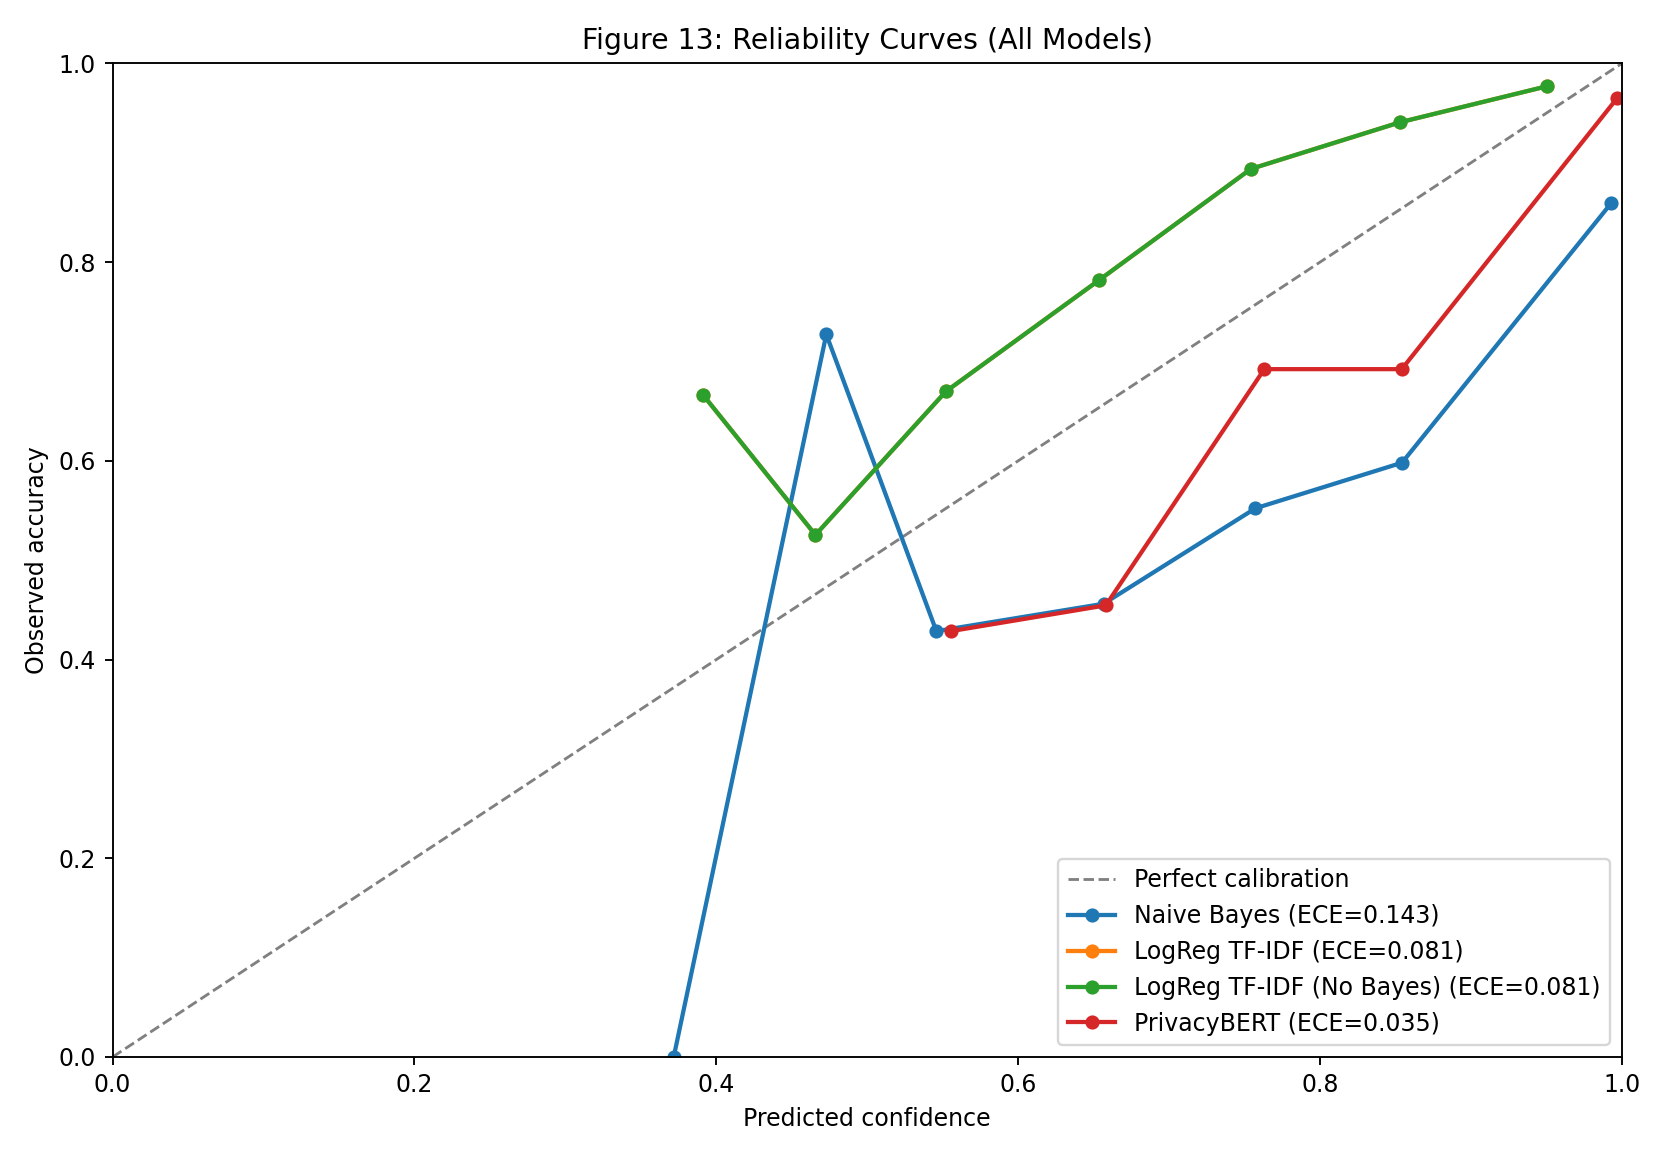 |
Reliability curves expose calibration quality by comparing predicted confidence vs observed accuracy per model. |
| Fig 14 | 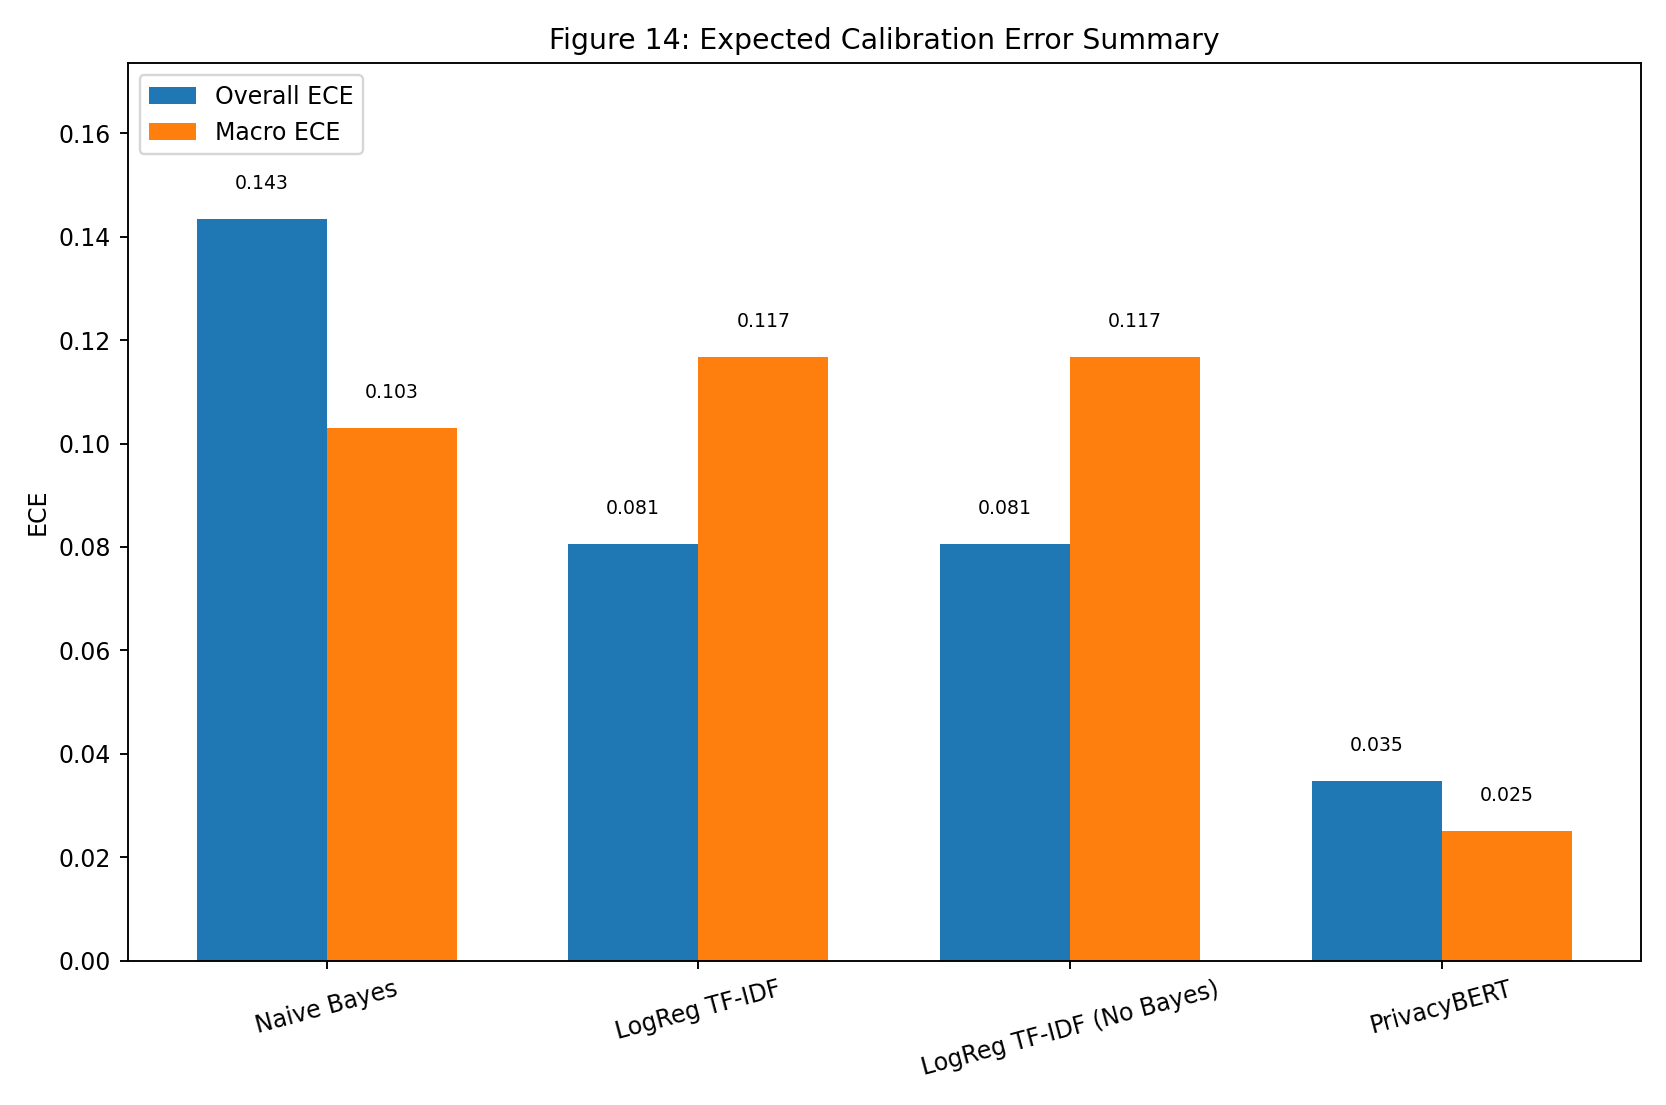 |
ECE summary highlights which variants are most/least calibrated on held-out predictions. |
| Fig 15 | 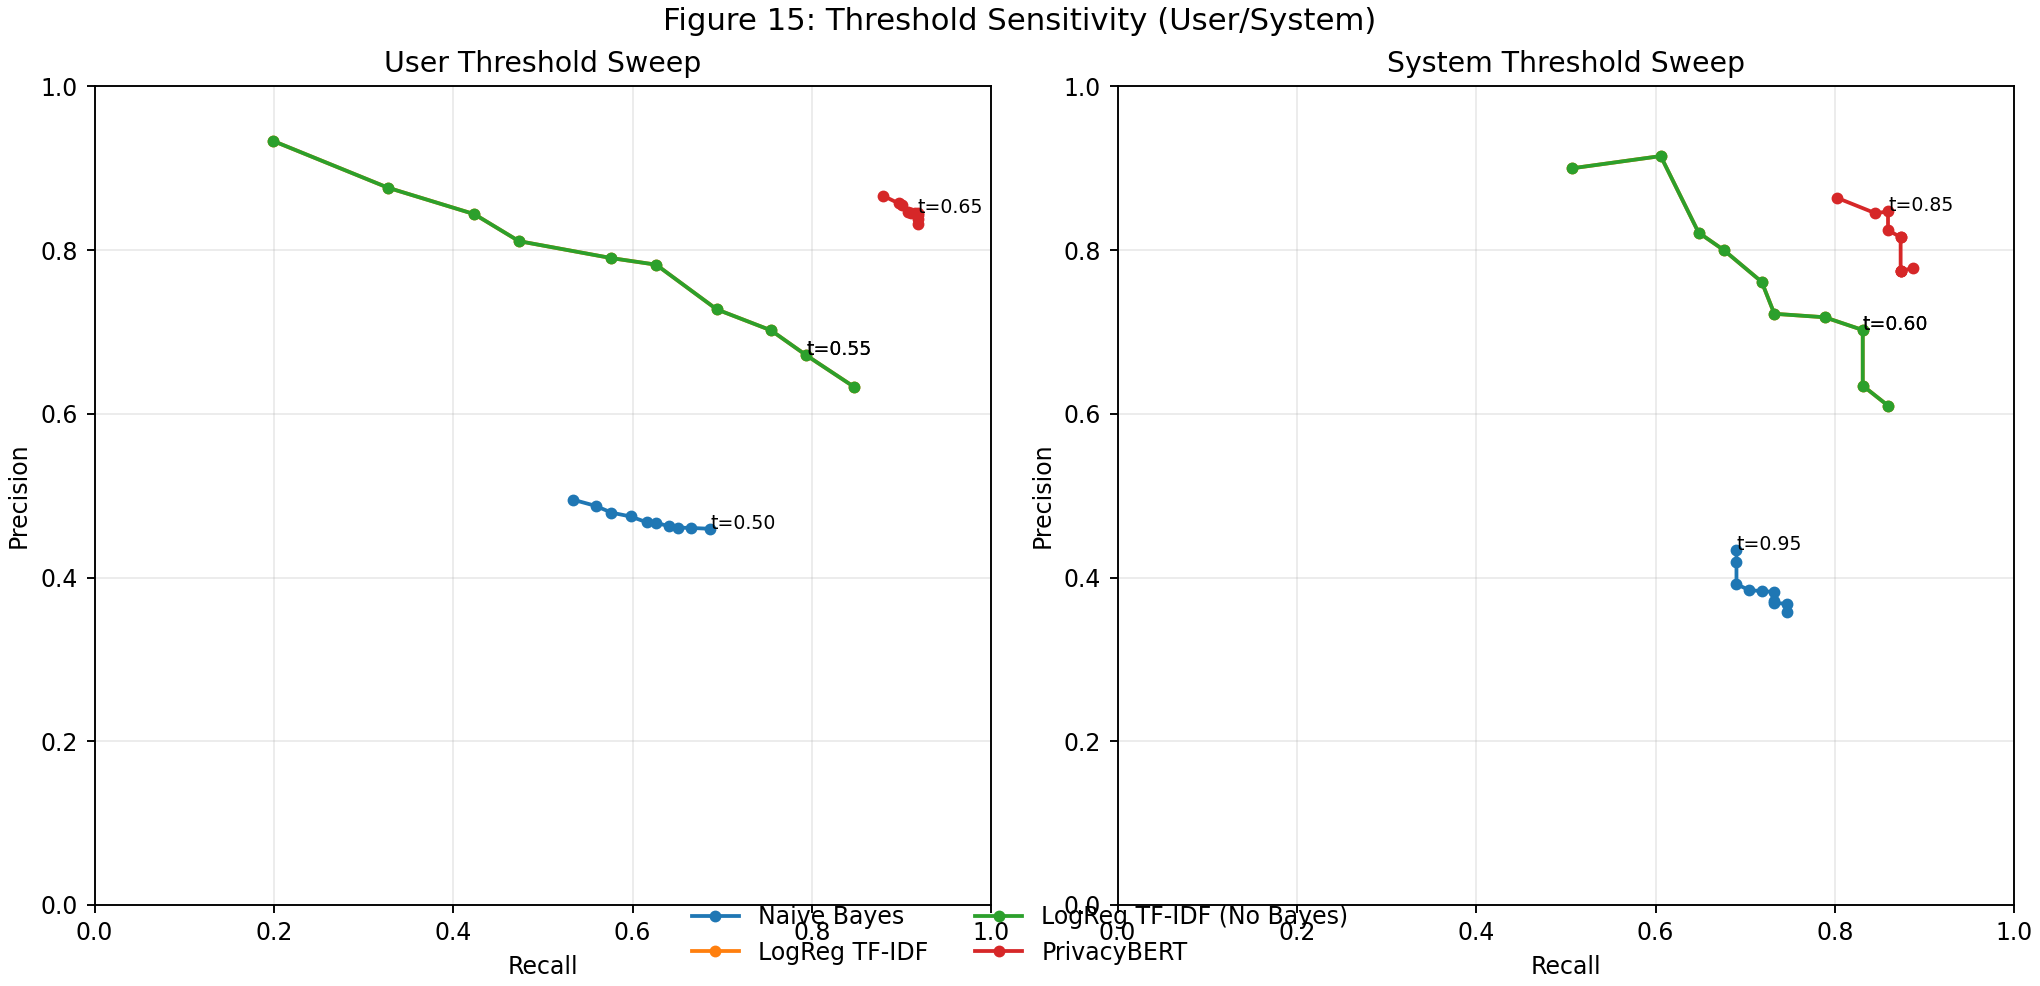 |
Threshold sweeps show user/system precision-recall operating point tradeoffs across models. |
| Fig 16 | 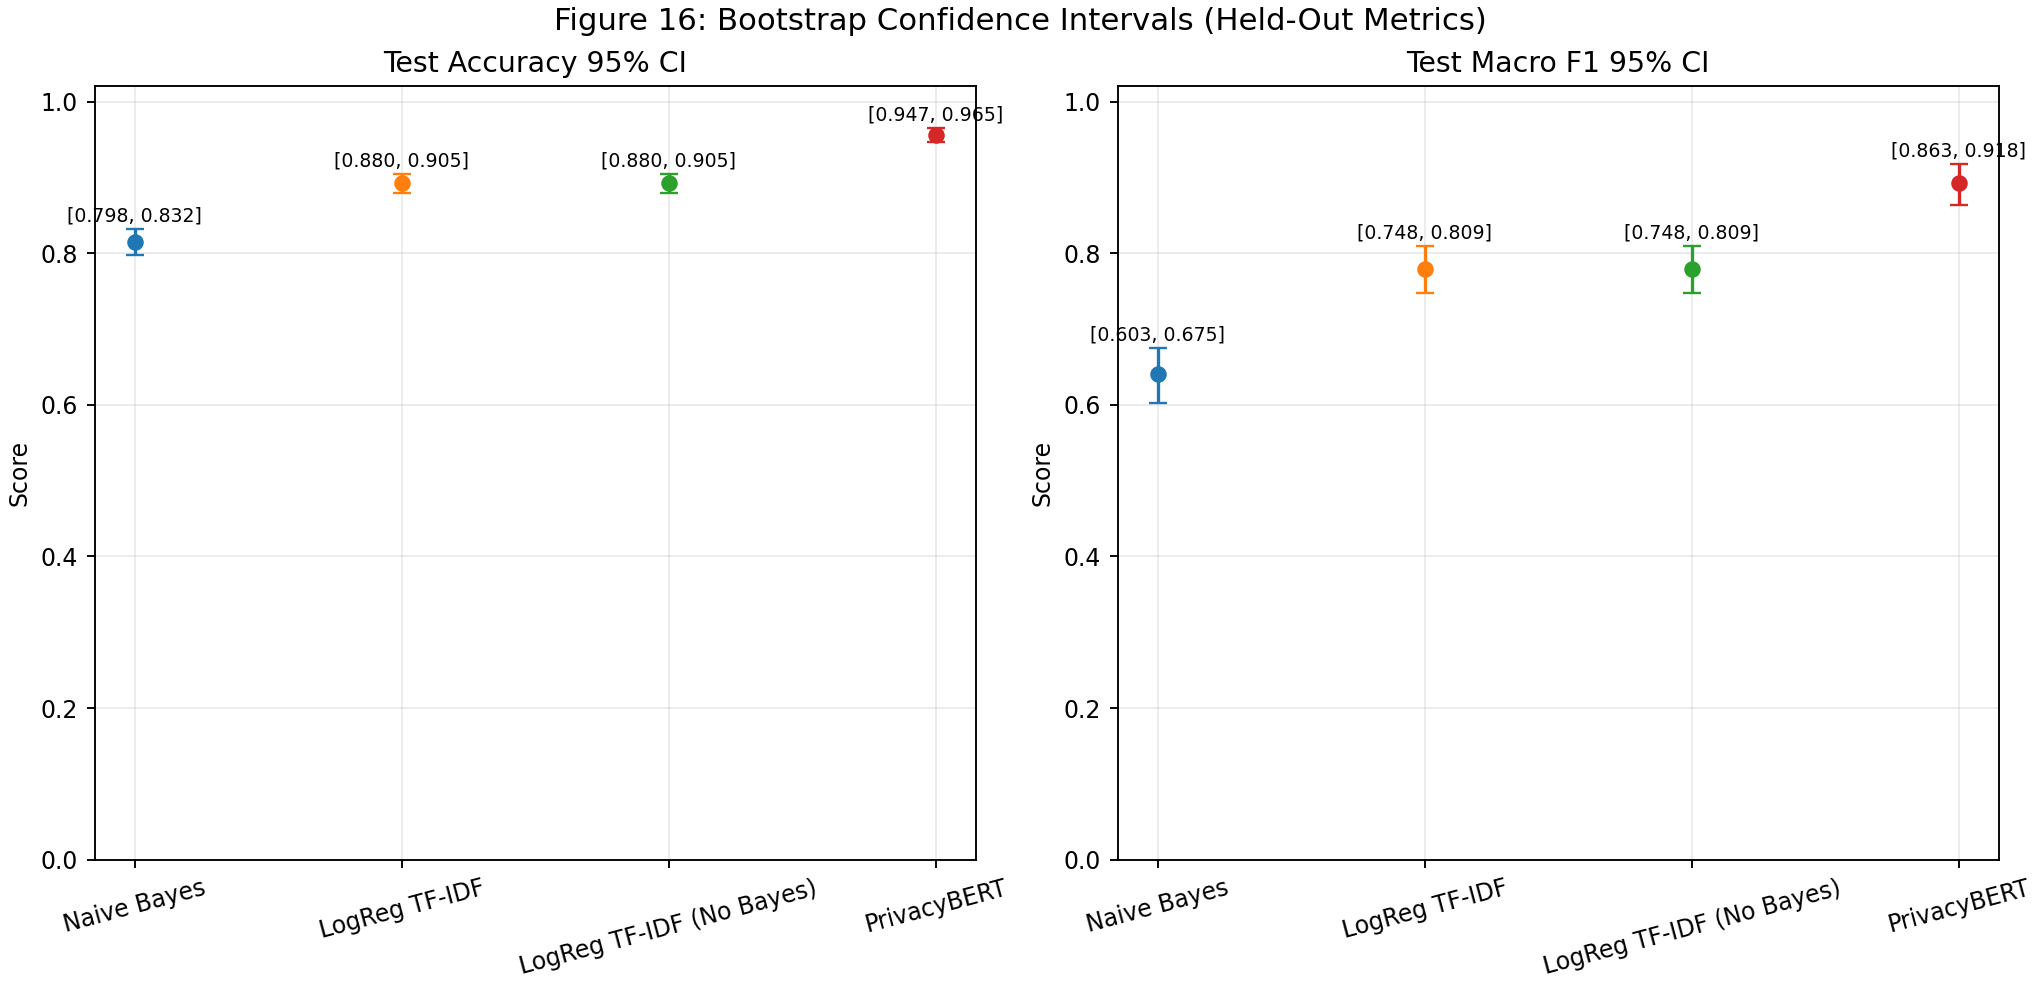 |
Bootstrap intervals quantify uncertainty around held-out accuracy and macro F1 comparisons. |
| Fig 17 |  |
Dated trend snapshots track run-to-run metric drift and ranking stability over time. |
Fig 5. Dataset Class Distribution
What this means:
- The corpus is still strongly organization-heavy.
- Majority-class strength can hide minority regressions; per-class and macro views remain mandatory.
Fig 6. Split Size Profile
What this means:
- The split is suitable for stable training plus held-out evaluation.
policy_overlap.* == 0confirms policy-level leakage protection.
Fig 7. Four-Model Aggregate Comparison
What this means:
privacybertis highest on validation and test for both accuracy and macro F1.logreg_tfidfandlogreg_tfidf (no bayes)have matching classifier bars, confirming Bayesian disablement affects scoring surface, not classifier output.- Both LogReg variants materially outperform NB on held-out aggregate quality.
Fig 8. Macro Metric Heatmap by Model
What this means:
- Heat concentration shifts upward from NB -> LogReg -> PrivacyBERT across macro precision/recall/F1.
- No-Bayes mirrors LogReg heat cells exactly on classifier metrics, reinforcing that the ablation only removes posterior scoring artifacts.
- PrivacyBERT delivers strongest minority-sensitive macro profile on both validation and test.
Fig 9. Test Per-Class F1 by Model
What this means:
- NB remains lowest for all classes, with biggest gap on
system. - LogReg and No-Bayes are identical: user 71.34% (0.713433), system 68.82% (0.688172), organization 93.55% (0.935466).
- PrivacyBERT is best on all classes: user 87.31% (0.873096), system 82.89% (0.828947), organization 97.40% (0.973954).
Fig 10. Test Confusion Matrices (All Models)
What this means:
- NB shows the highest organization -> user/system spillover.
- LogReg and No-Bayes reduce spillover and increase minority true positives versus NB.
- PrivacyBERT has the strongest diagonal concentration, indicating best class separation.
Fig 11. Bayesian Posterior Means with 95% Intervals
What this means:
- PrivacyBERT has the highest posterior means across user/system/organization levels with tight intervals.
- NB posterior means are stronger than LogReg posterior means in this run despite lower classifier metrics, emphasizing that posterior evidence scoring can rank runs differently from classifier accuracy.
- No-Bayes is intentionally N/A for this figure because Bayesian scoring artifacts are not produced when posterior scoring is disabled.
Fig 12. Delta vs Naive Bayes (Test Metrics)
What this means:
- All non-baseline models are positive vs NB across aggregate and per-class F1 metrics.
- LogReg and No-Bayes have equal deltas everywhere (same classifier outputs).
- PrivacyBERT produces the largest gains, especially for minority classes.
Fig 13. Reliability Curves (All Models)
What this means:
- Curves closer to the diagonal indicate better calibration.
- Divergence from the diagonal identifies confidence over/under-estimation regions.
Fig 14. Expected Calibration Error Summary
What this means:
- Lower ECE indicates better confidence calibration.
- Side-by-side ECE helps separate ranking by calibration quality from ranking by pure classifier accuracy.
Fig 15. Threshold Sensitivity (User/System)
What this means:
- Threshold sweeps surface precision-recall tradeoffs for minority classes.
- Best operating points can be selected by mission needs (precision-protective vs recall-protective).
Fig 16. Bootstrap Confidence Intervals (Held-Out Metrics)
What this means:
- Confidence intervals quantify uncertainty on held-out metric estimates.
- Overlapping intervals indicate where ranking claims should be treated cautiously.
Fig 17. Dated Run Trend Snapshots
What this means:
- Trend lines monitor drift and ranking stability across sequential runs.
- Run metadata is sourced from
artifacts/phase3_run_history.jsonlwritten by each pipeline execution.
Held-Out Quality Indicator Tables
Table A. Aggregate Held-Out Metrics by Model
| Model | Split | Rows | Accuracy | Macro F1 |
|---|---|---|---|---|
| multinomial_naive_bayes | Validation | 1803 | 81.64% (0.816417) | 62.59% (0.625907) |
| multinomial_naive_bayes | Test | 2272 | 81.47% (0.814701) | 64.01% (0.640117) |
| logreg_tfidf | Validation | 1803 | 88.96% (0.889628) | 75.80% (0.757970) |
| logreg_tfidf | Test | 2272 | 89.26% (0.892606) | 77.90% (0.779024) |
| logreg_tfidf (no bayesian) | Validation | 1803 | 88.96% (0.889628) | 75.80% (0.757970) |
| logreg_tfidf (no bayesian) | Test | 2272 | 89.26% (0.892606) | 77.90% (0.779024) |
| privacybert | Validation | 1803 | 95.12% (0.951192) | 87.24% (0.872441) |
| privacybert | Test | 2272 | 95.60% (0.955986) | 89.20% (0.891999) |
Table B. Test Per-Class F1 by Model
| Label | NB F1 | LogReg F1 | No-Bayes F1 | PrivacyBERT F1 |
|---|---|---|---|---|
| user | 55.24% (0.552408) | 71.34% (0.713433) | 71.34% (0.713433) | 87.31% (0.873096) |
| system | 48.18% (0.481818) | 68.82% (0.688172) | 68.82% (0.688172) | 82.89% (0.828947) |
| organization | 88.61% (0.886125) | 93.55% (0.935466) | 93.55% (0.935466) | 97.40% (0.973954) |
Table C. Bayesian Posterior Summary (Test)
| Model | Overall Posterior Mean | User Mean [95% CI] | System Mean [95% CI] | Organization Mean [95% CI] |
|---|---|---|---|---|
| multinomial_naive_bayes | 0.952613 | 0.916301 [0.890126, 0.942477] | 0.918496 [0.875283, 0.961709] | 0.964695 [0.955930, 0.973460] |
| logreg_tfidf | 0.809707 | 0.751016 [0.708318, 0.793714] | 0.763389 [0.687348, 0.839430] | 0.825634 [0.807973, 0.843295] |
| logreg_tfidf (no bayesian) | N/A | N/A | N/A | N/A |
| privacybert | 0.987510 | 0.972697 [0.954701, 0.990694] | 0.925694 [0.870264, 0.981124] | 0.992613 [0.988749, 0.996478] |
Measurement Target Status
- Calibration visuals implemented (
fig-13,fig-14) with reliability bins and ECE summaries. - Threshold-sensitivity sweeps implemented (
fig-15) focused on user/system classes. - Bootstrap confidence bands implemented (
fig-16) for held-out accuracy and macro F1. - Dated run trend snapshots implemented (
fig-17) backed by canonical run-history indexing.
Regeneration command:
PYTHONPATH=src python scripts/generate_phase3_dashboard_figures.py
Navigation
| ⬅ Back | Next ⮕ |